Basic Analysis
Phase Contrast is an MRI sequence that can be used to visualize flow. The phase contrast sequence contains 3 images: magnitude, complex difference, and phase. We will be focusing on the complex difference image to help us visualize anatomy and phase image for making measurements of flow.
We use ImageJ in this basic analysis walkthrough because it is free, available on multiple platforms, and allows the user to modify the images (when needed to address aliasing or other issues. Much more efficient analysis workflows are possible with supervised and unsupervised algorithms if large numbers of images need to be processed.
Other guides on this website show:
- How to detect (and ideally, fix) aliasing. Aliasing occurs when the value of a voxel exceeds the range of values allowed by the image parameters.
- How to check (and use VENC, the velocity encoding, measured in cm/sec).
- Please Link: relevant sections for Aliasing and VENC
Software Prerequisites
We recommend the following software:
- Download ImageJ (free for MacOS and Windows) for post-processing analysis of aliased images
- Download Horos (MacOS users) to view DICOM images
Steps for Measuring Flow With ImageJ
Note: we will demonstrate this workflow for an image of cerebral blood flow. However, other analyzing other flow (CSF, venous flow, etc) is very similar.
-
Open ImageJ
-
Open the image you want to analyze (File → Open)
-
Navigate through the images
Tip: If adjusting the window and leveling are necessary to view the image, select Image →Adjust →Window/Level
Tip: to switch between magnitude, complex difference, and phase images, use the Left/Right arrow keys
Tip: to zoom in on a vessel of interest, place the cursor of your mouse over the image and press the up-arrow key repeatedly until the image is zoomed in.
-
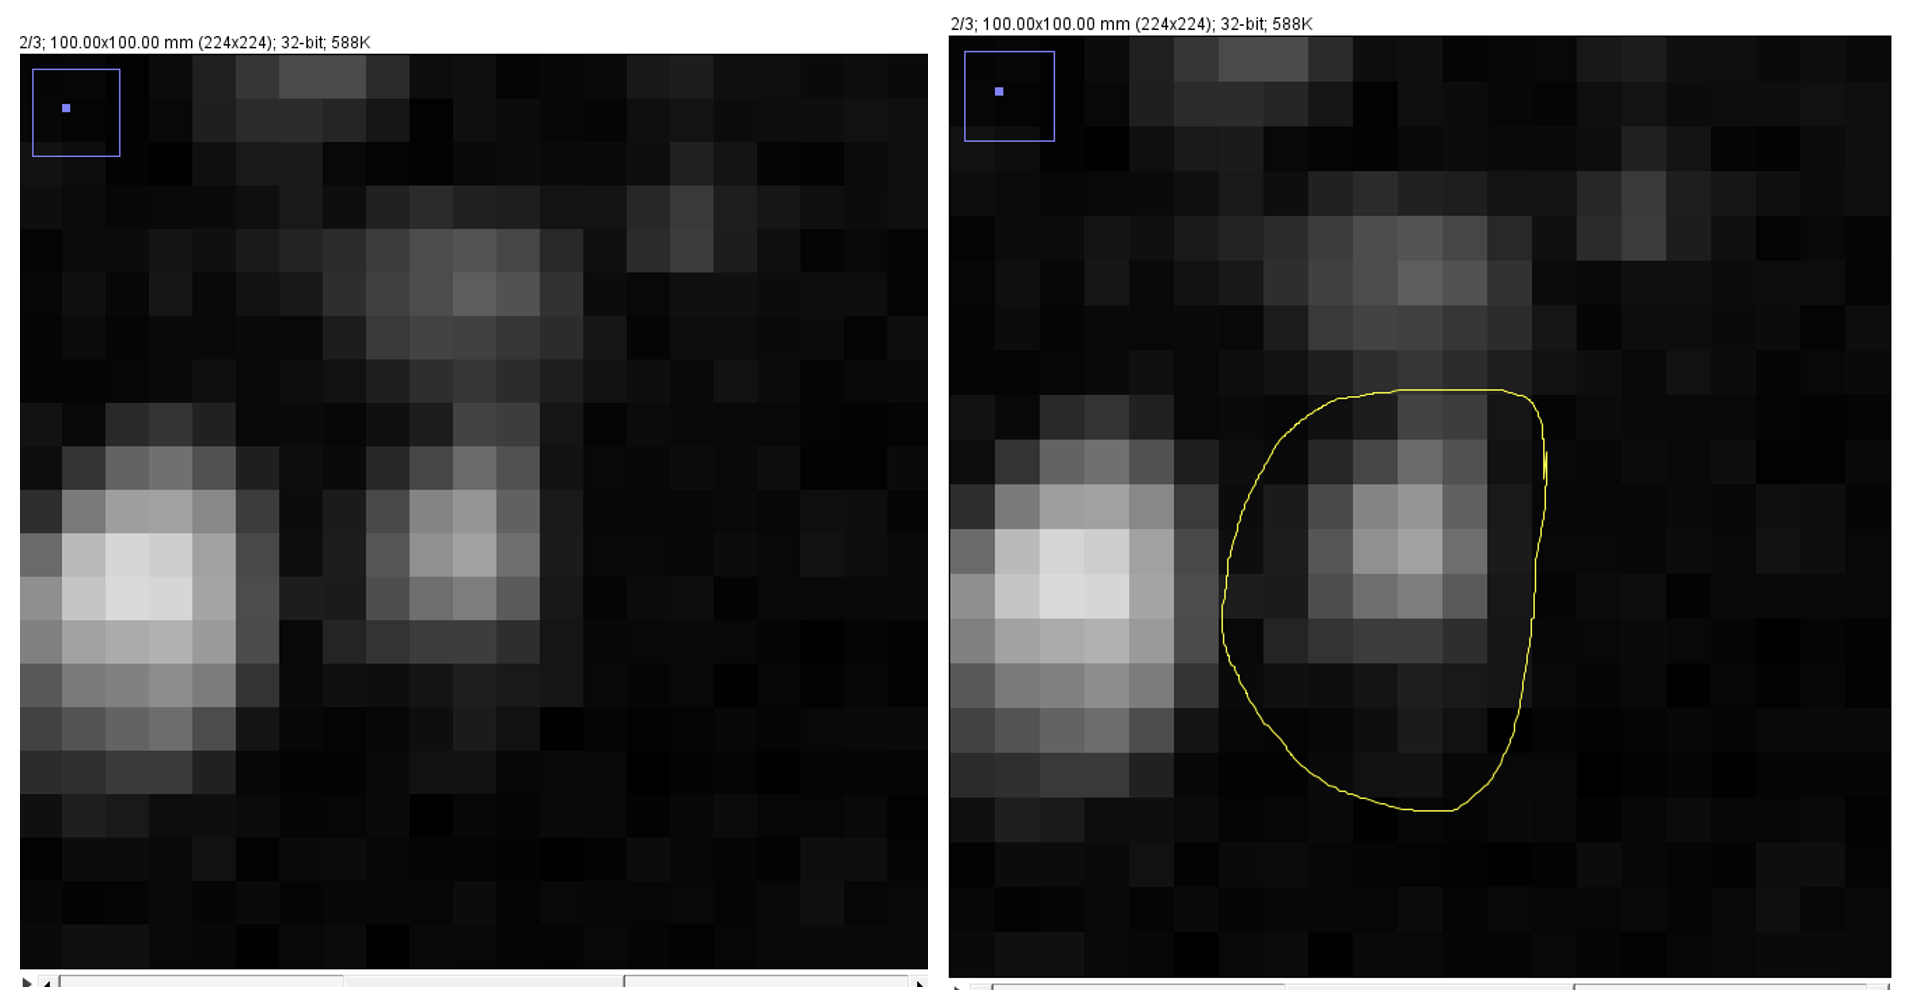
Draw a region of interest (ROI) around the vessel you wish to measure.
-
Select one of the ROI options in the ImageJ menu bar (rectangle, oval, polygon, or freehand). Oval or freehand are preferred. To ensure the most accurate measurement, it is best practice to draw the ROI of the vessel first on the complex difference image which will then save on to the phase image.
-
Place the cursor over the vessel you wish to obtain measurements of and zoom in until you can see the individual pixels/voxels of the image.
-
Draw your ROI around the voxels from the vessel on the complex difference image.
-
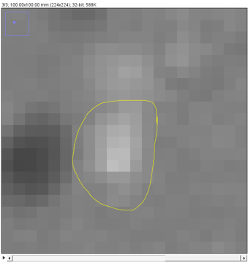
When you scroll to the phase image and adjust the window/leveling settings, the ROI will remain in the same place.
-
-
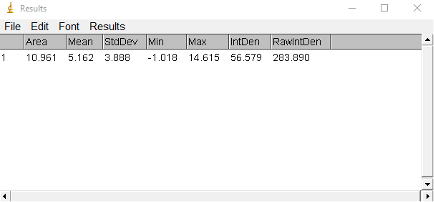
Right click within the ROI and select \'Measure\' and 'results' will open.
-
-
Add measurements by selecting Analyze→Set Measurements and select measurements you want to include. Useful measurements in the results window are:
-
Area (size of ROI)
-
Mean (the average intensity value in the ROI
-
StdDev (a measurement of intensity variation in the ROI)
-
Min (lowest intensity value in the ROI)
-
Max (highest intensity value in the ROI)
-
IntDen (the total intensity value in the ROI, i.e. Mean x Area)
- If the area units are in cm-squared, and the intensity value is in cm/sec then the IntDen will have units of cm-cubed / sec which is equal to ml/sec.